I. Analyzing a Real-World Scenario for Sources of Bias
Task:
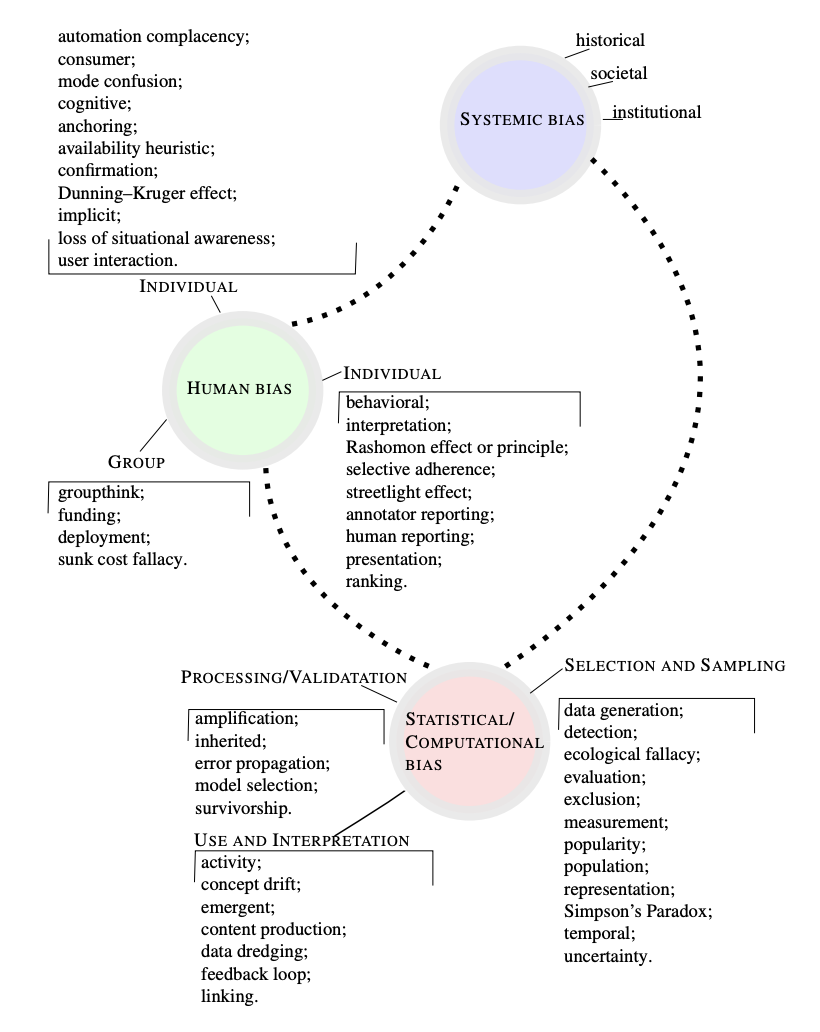
Using the figure below, we identify potential sources of bias in the following scenario and list them with justification, distinguishing whether these are likely to appear in the data collection/representation stage, the training/model building phase, or in the inference/action phase of the data processing pipeline.
Categories of AI Bias
Scenario:
Health care systems use automated tools to determine whether a patient should be inducted into an intensive “care management system” to cure what ails them. The idea is to determine which patients can benefit the most from being admitted to the system because it is expensive, and not everyone can be enrolled. It is hard to know who will benefit the most, so the systems instead try to predict a proxy: who will incur the most health care costs. The idea is that if your health care costs are predicted to be large, you probably need intensive treatments to be cured, and so you’re likely to benefit. The algorithm that makes this prediction uses the following training data set: input features for an individual are a list of insurance claim data from the previous year. Each such claim consists of
- Demographic information (age, sex, but not race)
- Type of insurance (private, medicare, medicaid, hmo, etc.)
- Disease diagnosis (usually expressed in a standard code)
- Procedures performed (X-rays, MRIs, surgeries, etc.—each expressed with a specific code)
- Medications
- Costs
The goal is to predict the cost of care this year. Formally, this is a regression problem with a mix of numerical and categorical variables, and a numeric output.
Response:
This is my favorite example of racial discrimination in automated decision making. I often use it to explain (to others) how an algorithm may still favor a particular social group(s) in prediction, despite being “blind” to group membership in the data. Namely, this case exemplifies the ways in which algorithmic neutrality not only fails to prevent biased decisions, but leads individuals to believe that their outcomes are fair and accept injustice willingly. It’s no surprise, given our nation’s historical legacies of oppression and racism towards Black and Brown individuals, that communities of color continue to experience systemic injustices on disproportionate levels. Among these are both the degree and quality of healthcare provision, as reflected in insurance claims data, which proves that healthcare expenditures in the U.S. are disparately low for marginalized groups. Thus, any model that utilizes this data to predict future healthcare costs is bound to replicate the systemic biases embedded within it to generate an adverse feedback loop of discriminatory outcomes—that is, unless used in tandem with a processing strategy explicitly designed to remove them. In this way, healthcare expenditure becomes a proxy for race, making its use as a basis for allocating those in more urgent need of care an implicit method for discriminating against vulnerable populations and keeping marginalized individuals on the margins.
Selection/Sampling Bias:
- ecological fallacy: “Occurs when an inference is made about an individual based on their membership within a group.” The implicit assumption that disadvantaged racial groups receive the same form of care or benefits than their privileged counterparts could be interpreted as an ecological fallacy.
- detection bias: “Systematic differences between groups in how outcomes are determined and may cause an over- or underestimation of the size of the effect.” Detection bias in this case stems from the fact that marginalized and non-marginalized racial groups benefit from healthcare on disparate levels which in turn leads the system to underestimate the care needs of individuals of color.
- measurement bias: “Arises when features and labels are proxies for desired quantities, potentially leaving out important factors or introducing group or input-dependent noise that leads to differential performance.” Similar to measurement bias, the computational bias reflected in this scenario can be attributed to the fact that the desired quantity is itself a proxy for a factor we do not wish to have any influence over decisions.
Processing/Validation Bias:
- model selection bias: “…Model selection bias also occurs when an explanatory variable has a weak relationship with the response variable.” Evidently, there is a weak relationship between the predictor and outcome in this case, given that insurance claims data (itself contaminated with systemic biases), rather than being able to distinguish those with more critical health conditions who may largely benefit from care management, reflects which (groups of) individuals have been previously prioritized by the system and are hence responsible for the majority of health care expenses regardless of actual health status.
- survivorship bias: “Tendency for people to focus on the items, observations, or people that ‘survive’ or make it past a selection process, while overlooking those that did not.” Decision-makers using the model discussed in this example are likely to display survivorship bias (at least to some extent), as their presumed goal is to select individuals with high projected care costs for admission into the care management system, while overlooking those with low cost predictions.
Use & Interpretation Bias:
- feedback loop bias: “Effects that may occur when an algorithm learns from user behavior and feeds that behavior back into the model.” If the overall intent is to use this model to predict future healthcare care costs beyond the following year, feedback loop bias will be an inevitable consequence due to the perpetual use of biased data for prediction—in accordance with the renowned saying “bias in, bias out”.
II. Analyzing a Particular (Mathematical) Notion of Fairness
Task:
Against the backdrop of fair clustering, we assess the degree to which the fairness measure described below eliminates any form of bias that one might be concerned with in the subsequent scenarios provided.
In various exploratory data mining tasks the goal is to cluster a collection of objects into groups and determine whether the groups have some meaningful structure. Formally, we are given a set of \(n\) points, where each point is represented by a \(d\)-dimensional feature vector \(x \in \mathcal{R}^d\). Defining the distance between two points as the Euclidean distance:
\[ d(x,y) = \sqrt{\sum_{i=1}^d (x_i - y_i)^2}, \]
we can then outline the \(k\)-means problem as follows. Partition the points into \(k\) clusters \(C_1, \dots, C_k\) such that the sum of squared distance from each point to its cluster center is minimized, where the center of a cluster is defined as the centroid of the cluster:
\[ \mu(C) = \sum_{x \in C} \frac{x}{\mid C \mid}, \]
where \(\mid C \mid\) is the total number of points in the cluster. More precisely, the goal is to find \(C_1, \dots, C_k\) such that the following expression is minimized.
\[ \sum_{j=1}^k \sum_{x \in C_j} d^2 (x, \mu(C_j))) \]
In the exploration of fairness measures (How Do Design Choices Affect Fairness?) we’ve considered how to evaluate the fairness of a binary classifier that produces a 0-1 output. However, we now consider a “fair” equivalent of the \(k\)-means problem.
Suppose each point \(x\) also has a color feature \(g(x)\), such that we can determine the fraction of points with a particular color within each cluster. Then the goal then becomes to make sure these cluster-specific or “local” fractional values match the overall “global” proportions of colors reflected in the data. For example, if we have 15 points of which 5 are red and 10 are blue, and we want to cluster them into 5 clusters, then each cluster should contain 1 red and 2 blue points.
Let us consider two scenarios in which one might wish to cluster points.
Scenarios:
-
Each point encodes different kinds of qualifications. The clusters represent people with similar qualifications. The “color” of a point is a binary gender encoding. The goal of the clustering is to group people into categories to target them with different kinds of job ads.
-
Each point represents the location of a voter in a state. The clusters represent voting districts for a state assembly. The “color” of a point is the person’s registered political affiliation, assumming that there are only two parties.
Response:
Scenario 1:
Metric Evaluation:
-
If we have balanced data, this clustering scheme would ensure that outcomes are relatively evenly distributed between “color” groups for similar qualifications.
-
If we have imbalanced data, then:
-
It’s possible for clusters to maintain any systemic bias that may be present in the data. For example, if there are considerable quality and pay differences between jobs being advertised, then the majority group will inevitably receive more ads for better paying jobs. However, the fact that the inverse would also hold true (i.e., the majority group would also receive more ads for jobs with inferior benefits) could be seen as a way of “evening out” this unfairness given that the degree to which each group benefits or is harmed by the algorithm would be relative to its size. That is, unless a “benefit” holds more weight than a “harm”, say.
-
It could be the case that correlation between clustering features and “color” attribute sees naturally occurring (qualification-based) clusters for which gender proportions vastly differ from that of the whole data. When this holds, the proposed fairness metric would yield sub-optimal clusters and prompt the algorithm to give inaccurate job ads. This is particularly concerning for imbalanced data since the clustering cost would not be evenly distributed among groups, which in this context, means the minority class receives disproportionately more inaccurate or irrelevant job ads.
Scenario 2:
Metric Evaluation:
- The proposed clustering scheme in this scenario would not only be ineffective in the face of balanced data, but is considered to be a specific form of gerrymandering that would otherwise result in an unfair political election. Although clustering in this way ensures that the distribution of political parties for a given district is consistent with that of the whole state, it does not ultimately yield a fair partitioning of districts that themselves reflect this desired distribution. That is, since every district would be won over by the majority class, the minority class would remain completely unrepresented at the state level and suffer from a compromised chance of winning the election.